Brain Mapping in Depression: What qEEG Can Reveal About the Depressed Brain
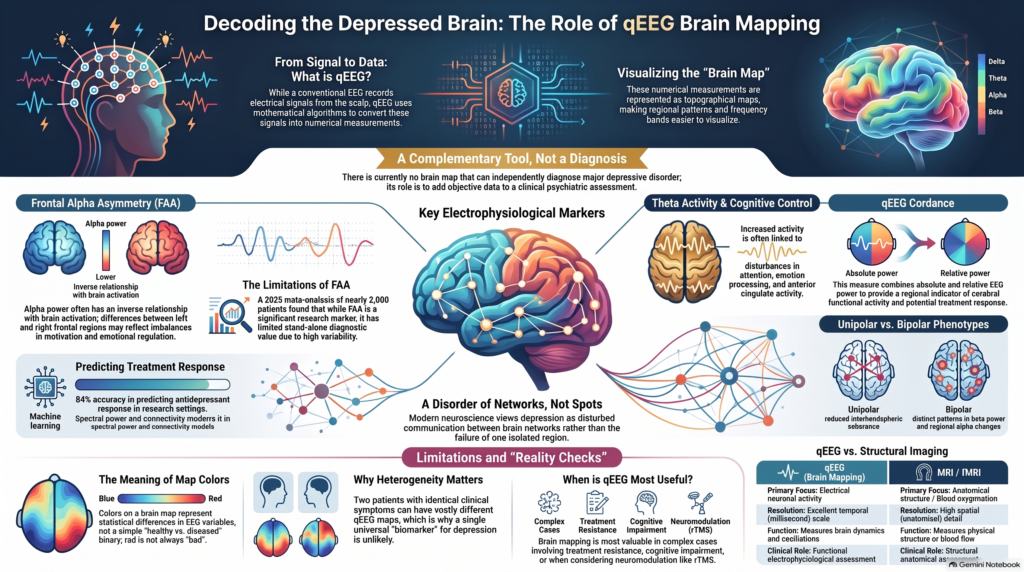 Can depression be seen in the electrical activity of the brain?
Depression is diagnosed clinically—through symptoms, history, functional impairment and psychiatric assessment. There is currently no EEG, MRI, blood test or brain map that can independently diagnose major depressive disorder.
However, depression is also a disorder of brain function. Research using quantitative electroencephalography (qEEG), or brain mapping, has identified measurable differences in electrical activity, cortical asymmetry and functional connectivity in some people with depression.
This creates an important distinction:
Brain mapping does not “prove depression.” It may provide objective neurophysiological information about how an individual brain is functioning in the context of depression.
That makes qEEG particularly interesting as psychiatry gradually moves toward more measurement-based and biologically informed assessment.
What Is qEEG Brain Mapping?
A conventional EEG records electrical signals generated by neuronal activity using electrodes placed on the scalp.
Quantitative EEG (qEEG) converts these signals into numerical measurements using mathematical and computational analysis.
It can examine:
- Delta activity
- Theta activity
- Alpha activity
- Beta activity
- Absolute and relative spectral power
- Dominant frequencies
- Frontal asymmetry
- Interhemispheric asymmetry
- Coherence and functional connectivity
- Relationships between different brain regions
- Changes in brain activity across repeated assessments
These measurements may then be represented as topographical brain maps, making regional patterns easier to visualise.
The review by Popa and colleagues describes qEEG as digital EEG processed through mathematical algorithms to analyse frequency bands, signal complexity, connectivity and network characteristics. The authors emphasise that its role in psychiatry is primarily complementary—to add objective information to clinical assessment rather than immediately establish a diagnosis.
What Happens in the Brain During Depression?
Major depressive disorder is not simply a state of sadness.
It can involve disturbances in:
- reward processing
- motivation
- emotional regulation
- cognitive control
- attention
- memory
- sleep and arousal
- psychomotor activity
- negative information processing
These functions depend on interconnected networks involving the prefrontal cortex, anterior cingulate cortex, limbic structures and other cortical and subcortical systems.
For this reason, researchers have increasingly moved away from searching for one isolated “depression centre” toward studying network-level dysfunction.
EEG is particularly useful for this purpose because it records neuronal activity with excellent temporal resolution.
What qEEG Patterns Have Been Reported in Depression?
There is no single universal EEG pattern of depression.
Different patients may demonstrate different electrophysiological features, and findings vary substantially across studies.
Nevertheless, several patterns have repeatedly attracted research interest.
The qEEG review provided for this article describes findings reported in depression including:
- frontal alpha asymmetry
- changes in frontal cordance
- frontotemporal slow-wave asymmetry
- reduced interhemispheric delta and theta coherence
- increased delta and theta power in some right-hemisphere regions
- increased posterior theta activity
- alterations in beta activity
These should be understood as research-associated patterns rather than diagnostic signatures.
1. Frontal Alpha Asymmetry: The Most Famous Depression EEG Marker
One of the most extensively studied qEEG findings in depression is frontal alpha asymmetry, or FAA.
Alpha activity is usually measured in approximately the 8–13 Hz frequency range.
A crucial concept is that alpha power often has an inverse relationship with underlying cortical activation:
More alpha activity → relatively lower cortical activation
Therefore, differences in alpha power between the left and right frontal regions may reflect differences in functional activation.
The Approach–Withdrawal Model
A major theoretical model proposes that:
Left frontal networks are relatively associated with:
- approach behaviour
- motivation
- reward pursuit
- positive affect
while right frontal systems are more strongly associated with:
- behavioural withdrawal
- avoidance
- negative affect
Depression—particularly when characterised by anhedonia, reduced motivation and behavioural withdrawal—was therefore hypothesised to involve relative left frontal hypoactivation.
Because greater alpha power may imply reduced cortical activation, this can appear electrophysiologically as altered left-right frontal alpha activity.
This became one of the classic neurophysiological models of depression.
But Is Frontal Alpha Asymmetry a Diagnostic Test for Depression?
No.
This is where modern evidence becomes important.
A 2025 meta-analysis included 23 studies with 1,928 participants with major depressive disorder and 2,604 controls. It found a statistically significant but small overall effect for frontal alpha asymmetry, with substantial heterogeneity between studies. The authors concluded that FAA has limited stand-alone diagnostic value, although it may contribute to a broader multimodal assessment.
This reflects an important evolution in the field.
Earlier research often asked:
“Does depression produce frontal alpha asymmetry?”
Modern neuroscience asks:
“Which patients with depression show frontal asymmetry, under what circumstances, and what does that phenotype tell us?”
That is a much more useful question.
Depression Is Neurophysiologically Heterogeneous
Two patients may both satisfy diagnostic criteria for major depressive disorder while having dramatically different clinical presentations.
One may have:
- marked psychomotor slowing
- hypersomnia
- fatigue
- poor concentration
Another may have:
- severe anxiety
- insomnia
- agitation
- rumination
A third may predominantly experience:
- anhedonia
- emotional numbness
- motivational impairment
It is therefore biologically unlikely that every patient will show precisely the same qEEG pattern.
This heterogeneity is one of the reasons a single biomarker such as frontal alpha asymmetry has struggled to become a reliable stand-alone diagnostic test.
The future of brain mapping in depression is consequently likely to involve multidimensional phenotyping rather than one EEG number.
2. Theta Activity and Depression
Theta activity, approximately 4–8 Hz, has attracted considerable attention in depression research.
Particular interest has focused on frontal and anterior brain regions because theta oscillations may relate to functions involving:
- cognitive control
- emotional processing
- attention
- anterior cingulate activity
- treatment response
Some studies have found increased theta activity in particular brain regions in depression, although findings differ between patient populations and recording methods.
The review supplied for this article describes increased delta and theta power in some right-hemisphere areas together with increased posterior theta activity among reported qEEG abnormalities in depression.
Again, theta elevation by itself does not diagnose depression.
3. Alpha Activity Beyond Asymmetry
Alpha activity should not be interpreted only as a left-versus-right phenomenon.
Brain mapping can examine:
- absolute alpha power
- relative alpha power
- individual alpha peak frequency
- regional distribution
- anterior versus posterior activity
- connectivity within the alpha band
Differences in these variables may reflect disturbances in cortical arousal, information processing and network organisation.
This is considerably richer than simply reporting:
“Left alpha high” or “right alpha high.”
4. Beta Activity
Beta oscillations are broadly associated with active cortical processing, attention and sensorimotor activity.
Altered beta activity has also been reported in depression. The review by Popa and colleagues includes changes in beta activity among the qEEG abnormalities described in depressive disorders.
However, beta activity is influenced by many factors including:
- anxiety
- muscle tension
- medication
- sleep
- arousal
- recording artifacts
Therefore an isolated increase or decrease in beta activity cannot be interpreted as a depression biomarker without appropriate clinical context.
5. Brain Connectivity in Depression
Perhaps one of the most interesting areas of modern qEEG is functional connectivity.
Depression increasingly appears to involve disturbed communication between distributed brain networks rather than dysfunction of one isolated cortical region.
qEEG can estimate relationships between signals recorded from different brain regions using measures such as:
- coherence
- phase relationships
- connectivity indices
- network organisation
Earlier qEEG research reported abnormalities in interhemispheric coherence in depressive disorders. The supplied review describes reductions in delta and theta interhemispheric coherence among findings reported in depression.
Modern machine-learning studies are increasingly combining connectivity with spectral power and asymmetry rather than depending upon any single EEG parameter. A meta-analysis of EEG-based treatment-response models found that frequently informative features included frontal and temporal spectral power, hemispheric asymmetry and connectivity measures.
6. qEEG Cordance: A Particularly Interesting Depression Marker
One of the more specialised qEEG measures studied in depression is cordance.
Cordance mathematically combines information from:
absolute EEG power + relative EEG power
to generate a regional measure that has been investigated as an indirect indicator of cerebral functional activity.
The uploaded review notes that cordance has been correlated in earlier research with regional cerebral perfusion and cerebral function.
Of particular interest has been prefrontal theta cordance.
Some studies have reported that changes occurring relatively early during antidepressant treatment may be associated with later clinical response.
This is attractive because psychiatric treatment currently has an unavoidable problem:
We often have to wait several weeks before knowing whether a treatment is working adequately.
An objective biomarker capable of detecting likely response earlier would therefore have considerable clinical value.
But that possibility remains an area of research rather than an established routine test.
Can qEEG Predict Which Antidepressant Will Work?
This is one of the most exciting—and most frequently exaggerated—areas of brain mapping.
Several EEG-based markers have been investigated for treatment prediction, including:
- theta cordance
- alpha activity
- frontal alpha asymmetry
- spectral power
- connectivity
- Antidepressant Treatment Response Index-type measures
- machine-learning combinations of EEG variables
A 2022 machine-learning meta-analysis included 15 studies evaluating EEG prediction of treatment response in major depressive disorder. Across 758 patients, pooled predictive accuracy was approximately 84%, with models incorporating features including spectral power, connectivity and hemispheric asymmetry.
That sounds extremely promising.
But there is an important qualification.
The investigators also identified substantial methodological variability, relatively small datasets, risk of overfitting and insufficient independent prospective validation. They concluded that EEG prediction models require larger studies and replication before widespread clinical implementation.
Therefore:
qEEG is not currently a validated test that can reliably tell every patient, “This antidepressant will work for you.”
The earlier review provided for this article similarly concluded that available evidence was insufficient to recommend qEEG routinely for selecting psychiatric treatment or monitoring antidepressant response.
Brain Mapping and Treatment-Resistant Depression
qEEG may become particularly relevant in treatment-resistant depression, where treatment selection becomes increasingly complex.
If a patient has already received:
- multiple antidepressants
- augmentation strategies
- psychotherapy
- combination treatment
then additional physiological information becomes potentially more useful.
Research has therefore explored EEG predictors of response to interventions such as:
- antidepressants
- repetitive transcranial magnetic stimulation (rTMS)
- neurostimulation
- other biological treatments
The 2022 EEG machine-learning meta-analysis found particularly promising predictive performance for rTMS response, although the authors stressed the need for independent prospective validation.
This is an important direction for precision psychiatry.
Brain Mapping and rTMS
rTMS targets cortical networks—most commonly regions involving the dorsolateral prefrontal cortex in depression.
It therefore makes intuitive sense that electrophysiological measurements of these networks may eventually help answer questions such as:
Which network is dysfunctional?
Which stimulation target is most appropriate?
Is the brain changing after treatment?
Can we identify likely responders earlier?
Research has already demonstrated associations between resting-state theta connectivity and subsequent rTMS response, although these biomarkers are not yet sufficiently standardised for routine individualised treatment selection.
Future approaches may therefore increasingly integrate:
qEEG + connectivity + neuronavigation + TMS + machine learning
rather than treating each technology separately.
Can Brain Mapping Distinguish Bipolar Depression From Unipolar Depression?
This is another clinically important area.
A patient presenting with depression may ultimately have:
- major depressive disorder
- bipolar disorder
- anxiety disorder with depressive symptoms
- adjustment disorder
- substance-related depression
- neurodevelopmental conditions
- neurological illness
The uploaded review describes research reporting different qEEG patterns between unipolar and bipolar depression.
For example, reported findings in unipolar depression included:
- reduced theta interhemispheric coherence
- frontal alpha asymmetry
- increased left frontal alpha power
while bipolar depression studies reported findings involving:
- reduced left alpha power
- increased beta power
- regional alpha changes
- altered alpha and theta coherence.
These findings are scientifically interesting, but they cannot currently replace clinical differentiation between unipolar and bipolar depression.
This distinction remains primarily dependent on careful assessment of:
- previous hypomania or mania
- episodicity
- family history
- antidepressant response
- age of onset
- sleep changes
- behavioural activation
- course of illness
Brain mapping should support—not bypass—that assessment.
qEEG May Be More Useful for Phenotyping Than Diagnosing Depression
This may ultimately become the most useful way to think about brain mapping.
Instead of asking:
“Is the qEEG positive or negative for depression?”
a more sophisticated approach asks:
“What is the neurophysiological profile of this particular patient?”
For example:
Patient A
High depressive symptoms
→ marked anhedonia
→ frontal asymmetry phenotype
Patient B
Depression + cognitive slowing
→ increased slow-wave activity
Patient C
Depression + severe anxiety
→ different arousal and beta profile
Patient D
Treatment-resistant depression
→ network-connectivity abnormalities potentially relevant to neuromodulation
These are conceptual examples rather than validated qEEG subtypes, but they illustrate where the field is heading.
Why qEEG Should Be Combined With Clinical Measurement
The strongest model is not:
Clinical assessment OR technology
It is:
Clinical assessment + psychometrics + cognition + neurophysiology
For depression, assessment may therefore combine:
Psychiatric interview
↓
Depression severity measurement
such as PHQ-9, HAM-D or MADRS where appropriate
↓
Evaluation of anxiety, bipolarity, sleep and substance use
↓
Cognitive assessment when indicated
↓
qEEG / brain mapping in selected patients
↓
Integrated clinical formulation
This allows us to examine depression at several levels rather than relying entirely on one source of information.
What qEEG Cannot Tell Us
A responsible brain-mapping service should be very clear about its limitations.
qEEG cannot currently:
- independently diagnose major depressive disorder
- prove that someone’s symptoms are biological rather than psychological
- reliably distinguish every depressed patient from a healthy person
- reliably differentiate unipolar from bipolar depression in an individual patient
- determine the severity of depression purely from map colours
- reliably select the perfect antidepressant for every patient
- replace psychiatric assessment
The review on qEEG in neuropsychiatric disorders specifically highlights methodological limitations including biological variability, recording conditions, electrodes, artifacts and differences in analytical techniques. It concludes that qEEG should generate additional objective information within a broader diagnostic assessment rather than immediately determine diagnosis.
Why Colour Brain Maps Must Be Interpreted Carefully
Brain maps can be visually impressive.
Areas may appear:
red
orange
yellow
green
blue
But these colours do not mean:
Red = diseased brain
Blue = healthy brain
The colours usually represent statistical or quantitative differences in a particular EEG variable.
Interpretation depends on:
- what parameter is being displayed
- absolute versus relative power
- recording condition
- reference montage
- age
- alertness
- medications
- eye-open versus eye-closed recording
- artifacts
- normative database
- clinical symptoms
The map itself is therefore only the visualisation.
The clinically important part is the interpretation.
Can qEEG Be Repeated After Treatment?
Yes, EEG can be recorded repeatedly because it is non-invasive.
This makes longitudinal brain mapping scientifically attractive.
Potential questions include:
Has slow-wave activity changed?
Has frontal asymmetry changed?
Has connectivity changed?
Are physiological changes occurring alongside clinical improvement?
However, repeated recordings need sufficiently similar conditions to make comparison meaningful.
Medication exposure, caffeine, sleep, alertness, recording quality and artifacts can all influence EEG activity.
Therefore, longitudinal qEEG should not become a simplistic “before versus after colour-map comparison.”
Brain Mapping Versus MRI in Depression
These technologies answer different questions.
MRI
Provides predominantly structural anatomical information.
fMRI
Examines changes related to blood oxygenation and functional activity.
qEEG
Measures electrical activity of neuronal populations with millisecond-scale temporal resolution.
Therefore qEEG is particularly suited to studying the dynamics of neural oscillations and connectivity.
It is better viewed as a functional electrophysiological assessment rather than an anatomical brain scan.
Is Brain Mapping Required for Everyone With Depression?
No.
Many patients can be diagnosed and treated appropriately through good psychiatric assessment without qEEG.
Brain mapping may be more interesting where there is:
- diagnostic complexity
- cognitive impairment
- unusual clinical presentation
- treatment resistance
- possible neurological contribution
- consideration of neurofeedback or neuromodulation
- a need for longitudinal objective assessment
- research interest
- a desire for deeper neurophysiological characterisation
The decision should therefore be driven by a clinical question, not simply by availability of the technology.
The Future: From Brain Maps to Precision Psychiatry
The most exciting development is not prettier EEG maps.
It is the combination of multiple forms of information.
Future depression assessment may integrate:
**Symptoms
- Cognitive performance
- EEG spectral power
- Functional connectivity
- Sleep characteristics
- Treatment history
- Genetics
- Digital biomarkers
- Machine learning**
EEG-based machine-learning approaches have already shown promising research performance for predicting treatment response, but the field still requires standardisation and independent prospective validation before such algorithms can routinely guide individual treatment decisions.
Likewise, the newest meta-analysis of frontal alpha asymmetry suggests that individual EEG biomarkers are unlikely to be adequate by themselves; their future value may lie within multimodal clinical models.
This represents the more realistic future of objective psychiatry.
Brain Mapping for Depression in Chennai
Depression treatment should begin with understanding the person, not simply interpreting a brain map.
But selected patients may benefit from going beyond symptoms alone.
My approach is therefore to combine traditional clinical psychiatry with objective assessment where it genuinely adds useful information.
Depending on the clinical situation, assessment may incorporate:
**Detailed psychiatric evaluation
- Standardised symptom measurement
- Cognitive assessment when required
- qEEG / brain mapping
- Evaluation of sleep, anxiety and neurodevelopmental factors
- Evidence-based pharmacotherapy
- Psychological interventions
- Neuromodulation or neurofeedback where appropriately indicated**
The objective is not to claim that technology has replaced clinical psychiatry.
It is to build a more measurable, transparent and biologically informed form of psychiatry.
Frequently Asked Questions
Can qEEG diagnose depression?
No. Depression remains a clinical diagnosis. qEEG may reveal electrophysiological patterns associated with depression and provide complementary information, but no currently established qEEG signature independently confirms major depressive disorder.
What brain-wave pattern occurs in depression?
Research has reported abnormalities involving alpha asymmetry, theta and delta activity, beta activity, cordance and functional connectivity. However, there is substantial variability between individuals and studies.
Does depression cause frontal alpha asymmetry?
Some patients demonstrate frontal alpha asymmetry, but the effect across populations is relatively small. A 2025 meta-analysis therefore concluded that FAA has limited diagnostic value as an isolated biomarker.
Can brain mapping choose an antidepressant?
Not reliably enough for routine stand-alone treatment selection. EEG-based predictive models are promising, but they still require prospective validation and standardisation.
Can qEEG help in treatment-resistant depression?
Potentially. EEG biomarkers and connectivity measures are being actively investigated for predicting response to antidepressants and interventions such as rTMS. Their greatest future value may be in treatment stratification rather than basic diagnosis.
Is qEEG painful?
No. EEG is non-invasive. Electrodes placed over the scalp record naturally occurring electrical signals from brain activity.
Depression Assessment and Brain Mapping in Chennai
Dr. Srinivas Rajkumar T
MBBS (Madurai Medical College), MD (AIIMS New Delhi), DNB, MBA (BITS Pilani)
Senior Consultant Psychiatrist
Apollo Clinic, Velachery, Chennai – Opposite Phoenix Marketcity
My clinical focus is on evidence-based, diagnosis-first psychiatry with objective assessment wherever it adds meaningful clinical information.
For selected patients with depression—particularly complicated, cognitive or treatment-resistant presentations—qEEG brain mapping can be incorporated into a broader psychiatric assessment rather than being interpreted as a stand-alone test.
The future of depression treatment is unlikely to be one biomarker or one brain map. It will be the intelligent integration of clinical psychiatry, objective measurement and neurobiology.
Selected References
- Popa LL, Dragos H, Pantelemon C, Rosu OV, Strilciuc S. The Role of Quantitative EEG in the Diagnosis of Neuropsychiatric Disorders. J Med Life. 2020;13(1):8–15. doi:10.25122/jml-2019-0085.
- Luo Y, Tang M, Fan X. Meta analysis of resting frontal alpha asymmetry as a biomarker of depression. npj Mental Health Research. 2025;4:2. doi:10.1038/s44184-025-00117-x.
- Watts D, Pulice R, Reilly J, et al. Predicting treatment response using EEG in major depressive disorder: a machine-learning meta-analysis. Transl Psychiatry. 2022;12. doi:10.1038/s41398-022-02064-z.
- van der Vinne N, Vollebregt MA, van Putten MJAM, Arns M. Frontal alpha asymmetry as a diagnostic marker in depression: fact or fiction? A meta-analysis. NeuroImage Clin. 2017;16:79–87.
- Tas C, Cebi M, Tan O, Hizli-Sayar G, Tarhan N, Brown EC. EEG power, cordance and coherence differences between unipolar and bipolar depression. J Affect Disord. 2015;172:184–190.